See your results
Use campaign results to decide what to investigate next: delivery, audience fit, message or timing. maxclicks records email delivery and response signals at campaign and workspace level. This guide explains where to read them and what they can establish.
Open the email you sent
In the top navigation bar, open Broadcasts and click the one you want to check. A broadcast you have already scheduled or sent opens on its Metrics tab.
Read the top-line numbers
You will see delivery and response counts. Check each definition below before interpreting them as people reached. Results keep arriving for a while after you send, so click Refresh to pull the latest numbers.
Understand what each number means
Here is what the main numbers tell you:
- Sent in a campaign or template funnel: the number of email records included in that report. Pending, rejected or failed records can be included; this total alone does not confirm provider acceptance.
- Sent on an individual email: the provider-accepted state, before a later delivery or engagement state takes precedence.
- Delivered: the receiving mail server accepted the email. That is not a promise of inbox placement, since it can still land in spam.
- Opened: an email had at least one recorded open. The summary counts each email once, not every open and not distinct contacts across several sends. It does not prove that a person read the message.
- Clicked: an email had at least one recorded link click. Repeated clicks on that email do not increase the summary count. It records an interaction, not a purchase or activation.
- Unsubscribed: email records marked unsubscribed. This is not a total of every change in the contact’s preference history; a preference change without an associated email need not increase this metric.
- Bounced: the email could not be delivered, often because the address is wrong or no longer exists.
- Complained: the person marked it as spam.
Act on what you see
Start with delivery: inspect failed recipients and bounces before interpreting engagement. Compare response across similar audiences and sending periods. Low clicks can justify reviewing the offer, content or call to action; rising unsubscribes or complaints can justify reviewing audience fit and frequency. These signals suggest what to investigate, rather than establishing a cause.
Ask maxinja: "How did my last broadcast do, and what should I change next time?" It reads the results and gives you plain suggestions.
Read the rate and its denominator
The same count can produce different rates. The campaign and template summary’s Messages clicked card shows Click-to-open rate; the workspace overview shows Click rate. Compare the labeled rate rather than assuming those cards use the same denominator.
| Rate | Calculation |
|---|---|
| Delivery rate | Emails with a delivery event ÷ the report’s Sent count. |
| Open rate | Emails with at least one open ÷ delivered emails. |
| Click rate | Emails with at least one click ÷ delivered emails. |
| Click-to-open rate | Emails with at least one click ÷ emails with at least one open. |
| Bounce or complaint rate | Emails with that feedback ÷ the report’s Sent count. |
| Unsubscribe rate | Emails marked unsubscribed ÷ delivered emails. |
Each calculation is multiplied by 100. A zero denominator displays 0%; that does not establish that a populated audience had no engagement. Counts come from recorded events and can change when feedback arrives.
For example, 100 email records, 80 with delivery, 40 with an open and eight with a click produce 80% delivery, 50% opens, 10% clicks and 20% click-to-open. These are illustrative counts. The click-to-open formula uses all emails with clicks; it does not require a separate recorded open on each clicked email. A client can record a click without loading the open-tracking image.
Campaign and template funnels count their linked email records, including records that have not been accepted. Workspace metrics instead select emails with a recorded send timestamp in the chosen period. The two reports can therefore cover different populations while a campaign is preparing. Check individual Emails statuses before describing a total as messages sent.
A note on bounces and complaints
Hard bounces and complaints create address suppressions automatically. Any suppression blocks future marketing; transactional messages are blocked by bounce suppressions. Suppression applies to the address, including other contacts that share it. Review consent and suppression behavior before interpreting an excluded recipient as a campaign error.
Trace the gap before planning another send
| Gap you see | Inspect next |
|---|---|
| Audience count exceeds sent emails | Missing or duplicate addresses, channel/topic consent, suppression, preparation errors and cancellations. |
| Preparation has not progressed | Campaign credit or quality hold, current readiness and the scheduled time. |
| Sent exceeds delivered | Individual email activity and provider delivery errors; allow for events still arriving. |
| Delivery is healthy but clicks are weak | Representative messages, audience fit and destination experience. Metrics suggest an investigation, not a proven cause. |
| A workflow has waiting runs | Delay deadlines, workflow pause, available credits, capacity and event-history evidence. |
Do not resend the whole audience to fill a reporting gap. A delayed event or uncertain provider acceptance can hide a message that was already sent. Use recipient history to decide what follow-up is appropriate.
See everything at once
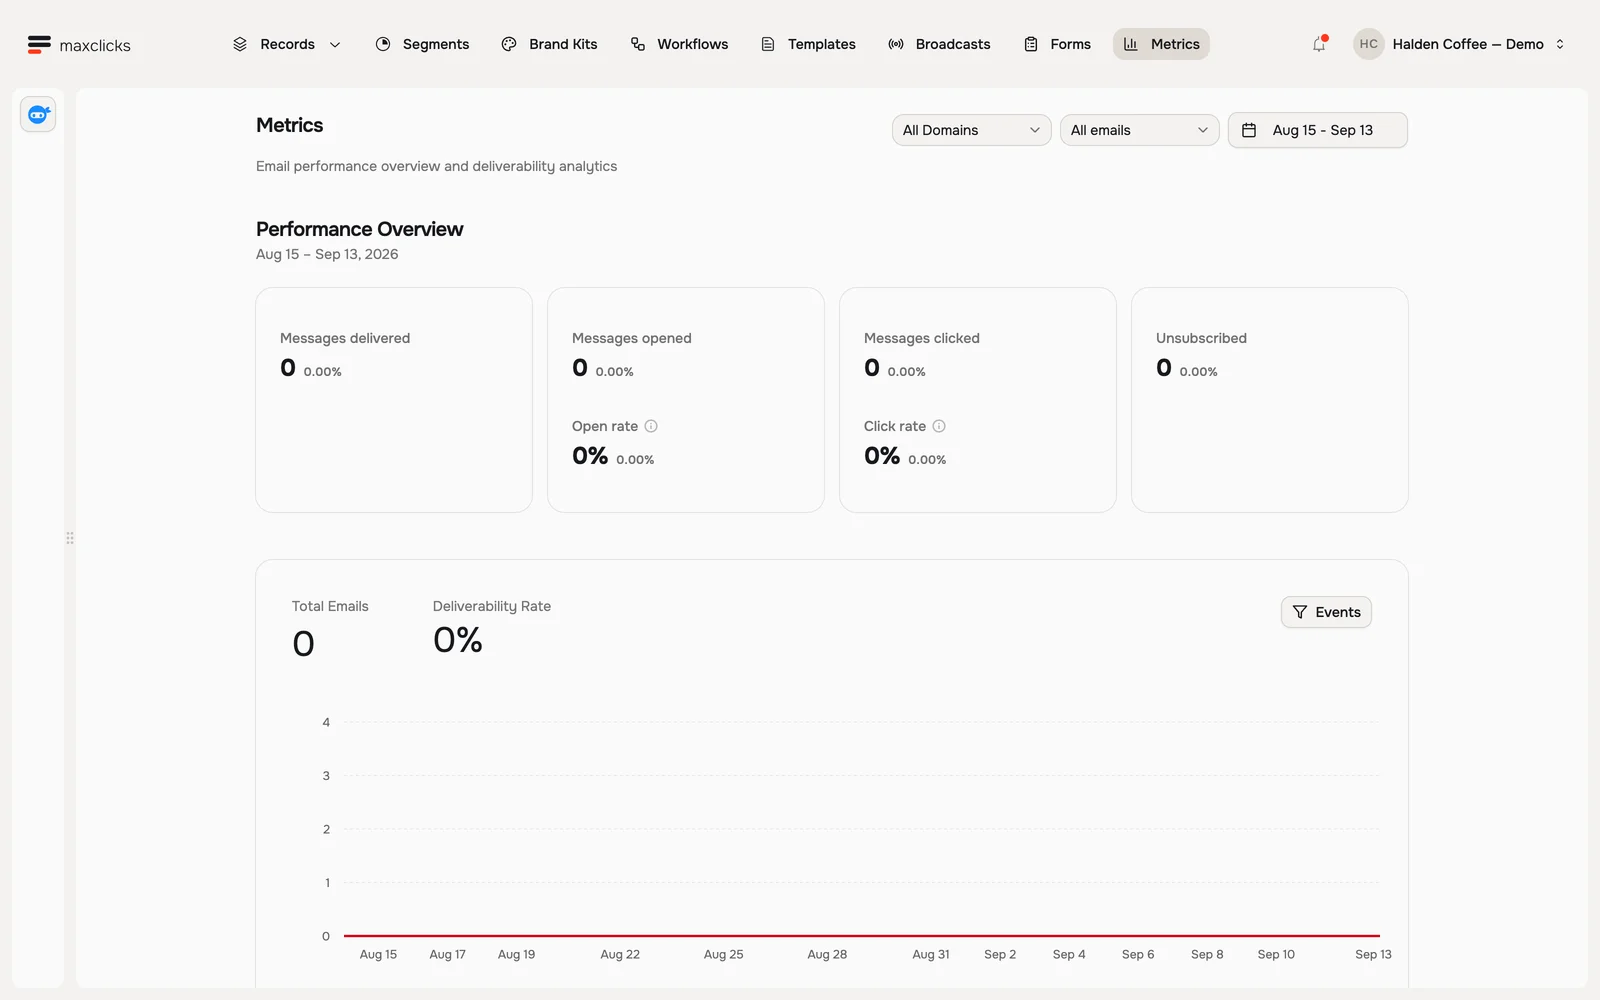
A broadcast tells you how one email did. Metrics, in the top navigation bar, rolls up every email your space sent over a date range: sent, delivered, opened, clicked, bounced, complained, and unsubscribed. Delivered, opened, clicked, and unsubscribed are each shown against the previous period, which is where a trend becomes visible. The page also ranks your best broadcasts, templates, and workflows.
You can filter by sending domain and by marketing or transactional. The presets run from today to the last 30 days, and a custom range can span up to 90 days: past that, the request is refused rather than trimmed. Presets use the browser’s local day boundaries. Use the same displayed date range and time zone when comparing with an external report.
The range selects emails by their send timestamp. Opens, clicks and delivery feedback recorded later still contribute to those selected emails, so reopening an earlier period can show different engagement. It is a report about emails sent in that period, rather than every interaction that occurred during it.
The previous period is the immediately preceding range of equal length, with the same sending filters. Comparison percentages are relative changes: an open rate rising from 20% to 30% displays a 50% change, while the absolute difference is 10 percentage points. When the previous value is zero, the displayed comparison is 100% for any positive current value and 0% when both are zero; read the underlying counts. The ranked lists show up to 10 broadcasts, templates or workflows, not a complete inventory.
Connect the signal to the business outcome
A click is not an order, and an open is not product activation. Bring meaningful business events, such as a completed purchase or first project, into your customer model when you need those facts for a segment or journey. The email metrics alone do not establish revenue attribution.
Next
Head back to Send a broadcast, or set up a workflow that sends the right email on its own.